Case Study: Museum Visitors

The Liverpool Museum of Natural History (LMNH) hosts hundreds of thousands of visitors every year, coming to view award-winning exhibitions such as "Fossils of the Ancient Nile" and "Inordinately Fond: Biodiversity in Beetles".
LMNH's core mission is 'to provide value to the Liverpool community and the wider public'. As part of this mission, the museum regularly collects data on visitor satisfaction and wellbeing, which is then used to target exhibition development and maintenance. In the past, the museum has collected this data through written surveys and online reviews, but LMNH has recently secured funding for a new project focused on gathering immediate user feedback. This project is currently being trialled in several key exhibitions.
Back in 2025, the museum appointed a new CEO who was particularly interested in using data to improve the visitor experience. As part of this, several "Smiley Face Survey Kiosks" were brought into the museum in order to collect data. Unfortunately, the CEO was found to have been embezzling money from the museum, and was removed from their post. However, the kiosks remain in place, and the museum is keen to make use of the data they collect.
The kiosks have been placed at the exits of the exhibitions; visitors are asked to rate their experience of the exhibition on a five-point scale (from 😡 to 😀). Each kiosk features two other buttons: an "assistance" button, for general enquiries, and an "emergency" button for immediate support.
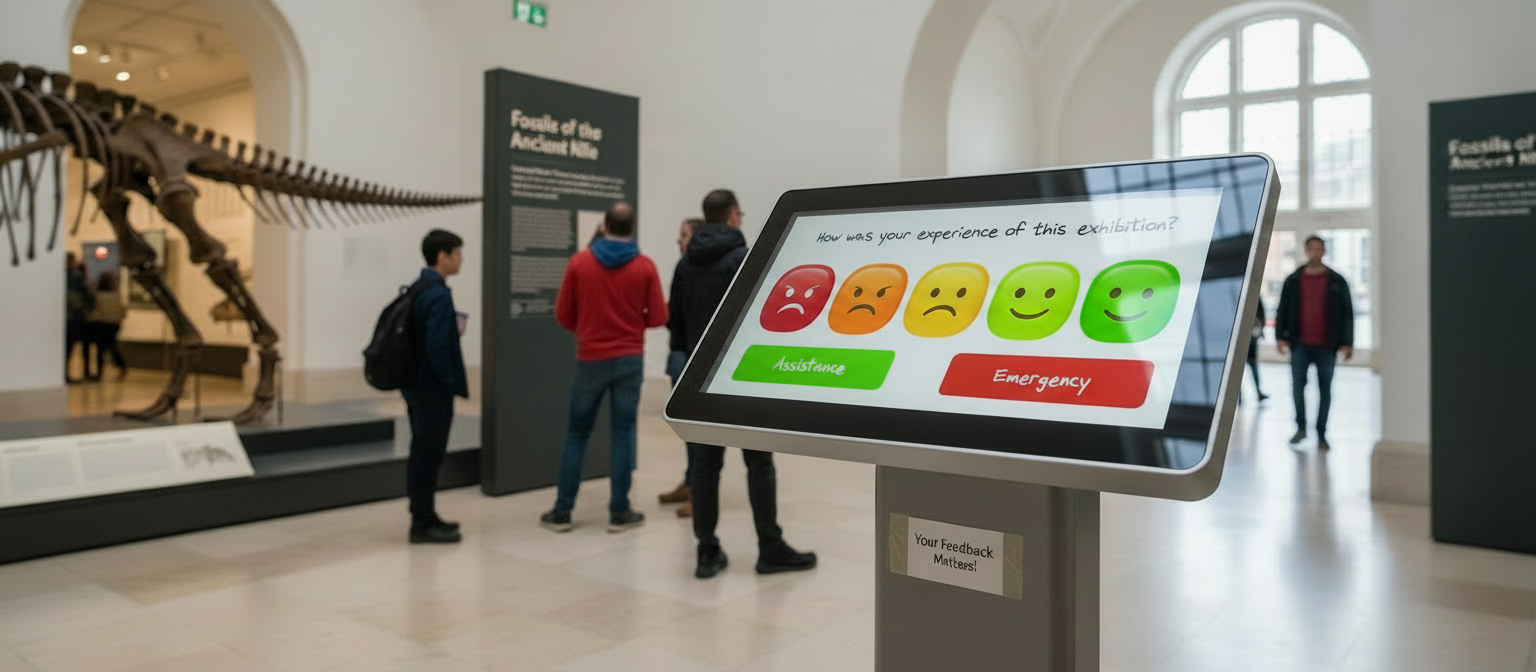
Since the CEO was dismissed, momentum of the kiosk project has stalled. The kiosks are still operational, but nothing is being done with the visitor data yet. LMNH wants to develop an automated pipeline that would combine, store, and analyse all the kiosk data automatically, allowing museum staff to access continually-updating information on the museum's operation.
By the end of this project, you should have helped the museum staff to be able to make informed choices about exhibition planning and visitor safety, based on real data.
Stakeholders
For this project, we have three main internal stakeholders within LMNH.

Angela Millay
Exhibitions Manager
Angela leads a team of exhibition producers who are responsible for planning and creating new exhibitions. Her team's KPIs are focused on increasing visitor engagement and satisfaction.
Currently, Angela uses visitor satisfaction surveys to identify successful exhibitions and plan out new work, but this is a slow, manual process, not showing results for several months after a new exhibition launches. She's hoping that the new system will allow her team to accurately identify high-performing exhibitions in near realtime, automating the data collection and analysis so she can focus on her core responsibilities.

Rita Pelkman
Head of Security & Visitor Safety
Rita is responsible for visitor safety. She plans out staff patrol routes and identifies potential hazards on the LMNH site. This planning is currently not data-informed at all, as there has previously been no tracking of where emergencies/problems occur.
Rita is unconvinced that the new system will provide sufficient value for the amount that it has cost the museum; she thinks that a greater investment in staff would have greater benefits. However, she is optimistic about the possibility of being able to see easily where visitors are most likely to ask for assistance.

Your Coach
Tech Lead
Your Coach will be acting as your technical lead for this project. They will be available to answer questions about the technical stack, help you troubleshoot issues, and provide guidance on best practices.
You should use them to help you make technical decisions, but ultimately you are responsible for the success of the project.
Throughout this project, you should keep in contact with stakeholders using the Stakeholder Communication tool.
You can ask questions, give updates, and get feedback on your work, all of which will help ensure you're moving in the right direction.
The Task
Over the next two weeks, you're going to build and deploy a data pipeline for the kiosk data. This will collate, clean, and store all the visitor interactions in a database, as well as making key metrics accessible through an online dashboard.
In this first week, we'll focus on understanding the data fully and designing an appropriate storage solution for it.
Outputs
During this week, you'll work on several related-but-distinct tasks. In total, you'll produce the following code outputs:
- An extract Python script that connects to S3 and downloads files relevant to the project
- A database that is fully designed and deployed to the cloud, with all tables created and populated (with a script to make this easily repeatable)
- A pipeline script that downloads kiosk data from S3 and uploads it to the database
- An analysis notebook, that connects to the database and explores the data it contains
Each of the above outputs should be independent, even if they interact with the same resources; running one script should not involve running any other.
The Data
For this week, we're going to work with a static sample of data from the kiosks, rather than realtime streaming. This allows us to prepare our pipeline stages carefully before having to grapple with live data.
The data sample is stored on an AWS S3 bucket. The bucket is a general-purpose one, containing many different files, and not all of those files are relevant to this project.
Specifically, there are two types of relevant file:
.csvfiles containing kiosk output.jsonfiles with details on specific exhibits
Kiosk Output Data
The .csv files for this project have a common naming convention; each file is entitled lmnh_hist_data_X.csv, where X is an integer showing where the file comes in the sequence. Any files matching this naming pattern contain historical kiosk data and should be combined together to form the full dataset.
The csv files all have the same columns:
at, site, val, type
atrefers to the date & time of the visitor interactionsiterefers to the unique ID of a specific exhibitvalis a number representing what button the visitor pushed- Values from
0to4are ratings, with4representing the highest rating - A value of
-1means that one of the other buttons ("assistance" or "emergency") has been pressed
- Values from
typeonly has a value when thevalfield is-1;0represents the "assistance" button,1the "emergency"
While ratings are stored numerically, each one does have an associated description:
- 0: Terrible
- 1: Bad
- 2: Neutral
- 3: Good
- 4: Amazing
LMNH has no current plans to change the number of buttons, or the meaning of each button, but would like the option to do so easily in the future. Your eventual data storage solution should be flexible enough to accommodate this.
Exhibit Data
The .json files for the exhibits follow a similar naming structure - lmnh_exhibition_XXXXX.json - where XXXXX is a single word (of no set length) describing the exhibition. Each file describes a different exhibition and has the following keys:
EXHIBITION_NAME, EXHIBITION_ID, FLOOR, DEPARTMENT, START_DATE, DESCRIPTION
Data Validity
Although care has been taken to clean and prepare the sample data for analysis, data cleaning is always an imperfect process, and there may well be small issues within the dataset. More importantly, the eventual input data stream will not have been cleaned in the same way, and LMNH may decide to change which exhibitions are being monitored at some point in the future. Taken together, this means that although direct data cleaning will not be a focus for this week, building testable, extensible code that doesn't make too many assumptions about the data is very important.
Technical Stack
For this project, you'll be using the following technologies:
- Python as the main programming language
- S3 is where the data is stored currently
- RDS hosted on AWS as the end cloud database solution
- Terraform to deploy all infrastructure to AWS
- Jupyter notebooks for data exploration and analysis
- GitHub for version control and code storage
You are welcome to use any additional libraries or tools that you feel are appropriate, but the above are the core technologies that you should be using.
Security
Security is a key concern for LMNH, especially when dealing with visitor data. Although the kiosk data is not personally identifiable, it is still important to ensure that it is handled securely.
For this project, you should ensure that:
- No sensitive information (e.g. database credentials) is stored in your code repository
- All data transfers are done over secure connections (e.g. HTTPS, SSL)
- Access to cloud resources is restricted to only those who need it
- Any third-party libraries used are up-to-date and have no known vulnerabilities
- You follow best practices for security in Python and cloud computing
- You do not expose any sensitive information in your code or documentation